

 Solar Data and the Energies going into the Week of Oct 7 2018
Although I had this article written in my mind and drafted on my other blog, I’ve decided to switch the Solar Data articles to this website, which is why I’m publishing late (after the weekend). I feel that these energy articles really go well with the direction I’ll be taking my blogging on this website. Stay tuned for more updates!
Remember the Highest Good of All Prevails (Weekend of Kavanaugh Confirmation)
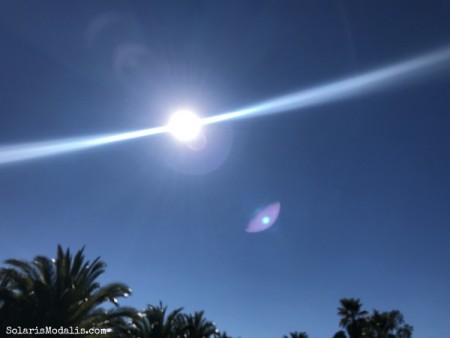
The energies are amazing this weekend. The blue of the sky is azure – clear and crisp. Absolutely beautiful.
I’ve decided I’m going to take some time off of commenting and participating in social media. So about 4 to 6 weeks. Let’s see what happens. I have the feeling that it a period, through about the same in which Venus is retrograde, in which And through the election too if I can stand it.
I see the energy shift causing great elevation off of whatever stuck set points we were fixed to before. I feel like my whole world is up in the air and any piece could shift, even the dreams I have held dear or the thoughts I have held the closest.
So I’m going to focus on my own center, and see what it’s really like there, freed from whatever is not me, freed from all that is not mine.
That’s what these energies seem to support, to me, right now.
They have been hella strong, too. Look at the ‘light’ coming through.
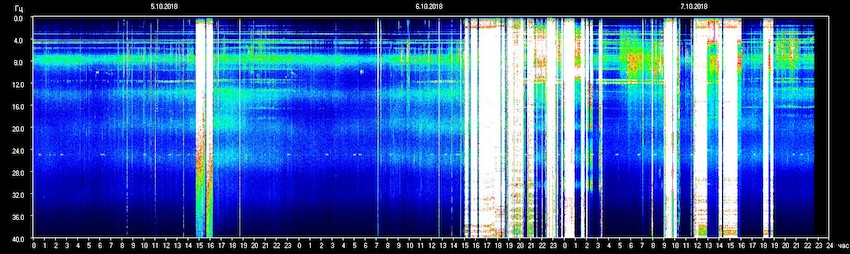
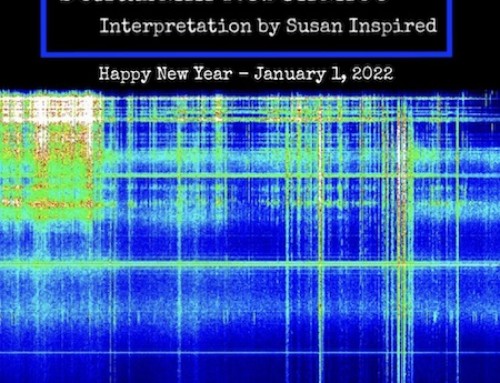
Schumann Resonances by TESIS Laboratory of X-ray Astronomy of the Sun. Time zone is UTC +7 hours.
Let’s take a minute to understand what the heck this chart means. It’s impressive and many would describe the Schumann Resonance as being ‘off the charts’.
What is really happening, here? The frequencies of the Schumann Resonance stay in the same range. As far as we can tell from the data, nothing changes with regard to these ranges, the resonant frequencies bounce up and down day today within them. There is more than one Schumann Resonance; the different ones are called modes.
The first mode averages about 7.83 Hz (hertz); this resonance is also know generally by light workers as the heartbeat of the Earth or the frequency of the Earth. The data that I use tracks four of the Schumann Resonance modes.
I have noticed anecdotally that changes in these data sets seem to correlate to changes I feel in energy or in my physical body, and I track those observations in this series of articles titled ‘Solar Data’.
I look at these charts every morning and have for about two years. It’s just that I’ve now gotten the courage and the clarity to write down my thoughts on the energies, and to share them.
My passion is to correlate broader trends to see how these effect us personally. And as energetic beings, each of us generating our own EM fields, or electromagnetic fields, from the energy system of our hearts, it makes sense that the electromagnetics in the atmosphere would effect all of our bodies, also – physical, mental, emotional, spiritual and so on. That’s my view.

Schumann Resonance Range of Frequencies by TESIS Laboratory of X-ray Astronomy of the Sun. Time zone is UTC +7 hours.
Here is what is ‘off the charts’ and what is changing, in the data in my view:
The amplitude (how strong the frequency comes through, energetically) of the resonances will rise and even spike, sometimes dramatically.
The Q values (the quality or the clarity or ‘clear tone’) of the resonances will rise and even spike, sometimes dramatically.
Let me clarify: I’m talking within periods of days. At the moment, as a lay person, I don’t have access to data that would show longer term trending.
Why does the Schumann Resonance graph look as impressive at it looks, on a day like today?
Schumann Resonances by TESIS Laboratory of X-ray Astronomy of the Sun. Time zone is UTC +7 hours.
What you see on the graph above is a two dimensional visual representation of third and fourth dimensional concepts on a flat chart. I include ‘fourth dimensional’ because these resonances represent frequencies that are electromagnetic. In my view, electricity is fourth dimensional.
Here are the moving parts: the frequency itself, the strength of it’s energy, it’s clarity, the duration (over time) and numeric values (indicating the actual frequency and corresponding levels of clarity and energetic strength) of all of these. All of this is what you are seeing, put together, in the graphic representation above.
Now that we have addressed these concepts, let’s look at what does this mean for us as human beings, these past few days.
Amplitudes were up substantially and, for the first mode resonance, peaked impressively at 110 – that’s very strong. My observations on strength are anecdotal and are based on my visual observations of these charts over about 2 years.
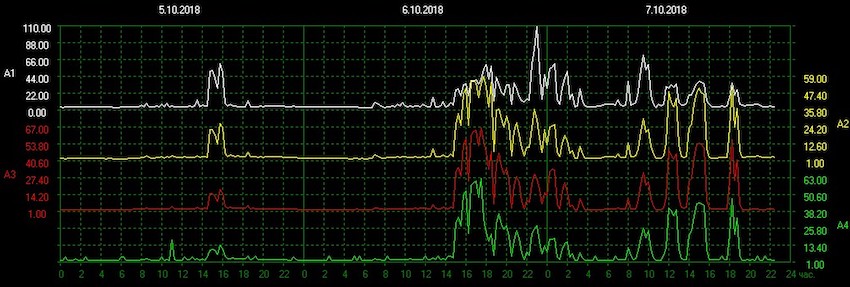
Amplitudes of the Schumann Resonances by TESIS Laboratory of X-ray Astronomy of the Sun. Time zone is UTC +7 hours.
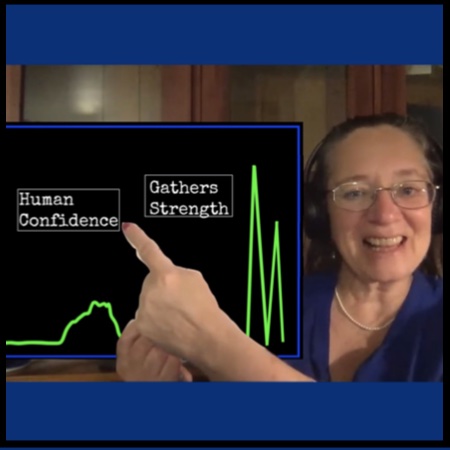
Q values spiked across the board as well, but a major pattern change occurred back on October 4th, 2018 on these charts, that is worth taking note of. Note the spaces in the spikes in the green colored line charge below. Previously, ‘spikiness’ in this resonance was significantly more rapid. The big change was that spaces were opening up over periods of hours in the quality spiking.
What did this do? Quality went from being clear, clear, clear, clear, to the frequency having big spaces where a broader expanse over a range of ‘tones’ or variations around the core frequency occurred.
This is like a pause, a big exhale, a sigh of relief, where your energy as a human being expands outward horizontally. In the human energy field, the effect is that space opens up and an inflow of something new can occur.
Let’s take a look at what else happened next in the data – because it is exciting!
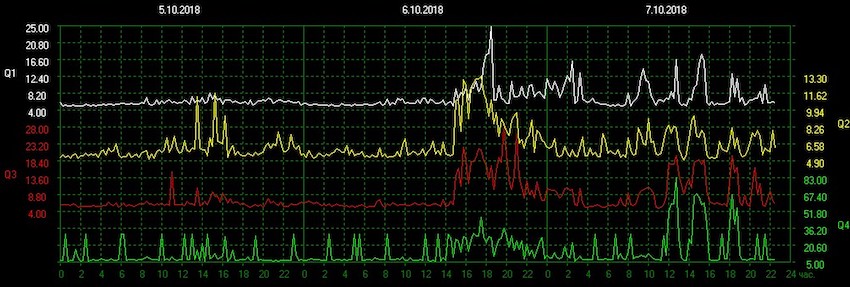
Q Values of the Schumann Resonances by TESIS Laboratory of X-ray Astronomy of the Sun. Time zone is UTC +7 hours.
The solar flaring activity still has what I’ve called a ‘scrubbing’ pattern. Interestingly, the ‘space’ or substantial decrease each day in solar flare activities occurred just before major amplitude spiking and during the spaces opening in the green line Q values.
This spacing of solar flaring to me is like a ‘pulling of energy’ towards the sun. Usually, energies pour from the sun in flaring to Earth, but in these spaces, it feels to me like there is a movement of energies back towards the sun – like periodic ‘clearing’, and this is happening once every day, consistently, for weeks now.
What is being ‘scrubbed’ from our electromagnetic environment? I’d guess on a more global scale, it is 4D entities that no longer can stand the ‘scrubbing’ from the Sun (the solar flaring) being pulled out of Earth’s energy environment.
On a personal level, this allows energies to come up for release from deep within our fields – so emotions and wild feelings can run rampant; it appears that chaos runs amok.
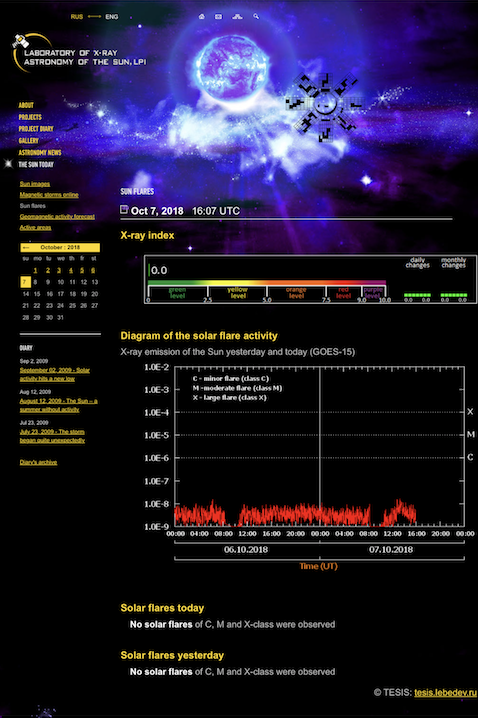
Solar flares by TESIS Laboratory of X-ray Astronomy of the Sun. Time zone is UTC +7 hours.
When I look up at the skies, though, here is what I saw this weekend: Lacey clouds and strong sunshine. From my perch at open sky, where I can almost always see the Sun, I report this to you: Higher dimensional galactic frequencies abound. What appears to be against us, cannot succeed. What appears to be chaotic, will visibly end in the highest good being achieved.
The geomagnetic confirm the softness of the energies of previous days, but look what happens as the Schumann Resonances are also peaking in strength and clarity – geomagnetic flare in the atmosphere. It’s going to be a tumultuous week.
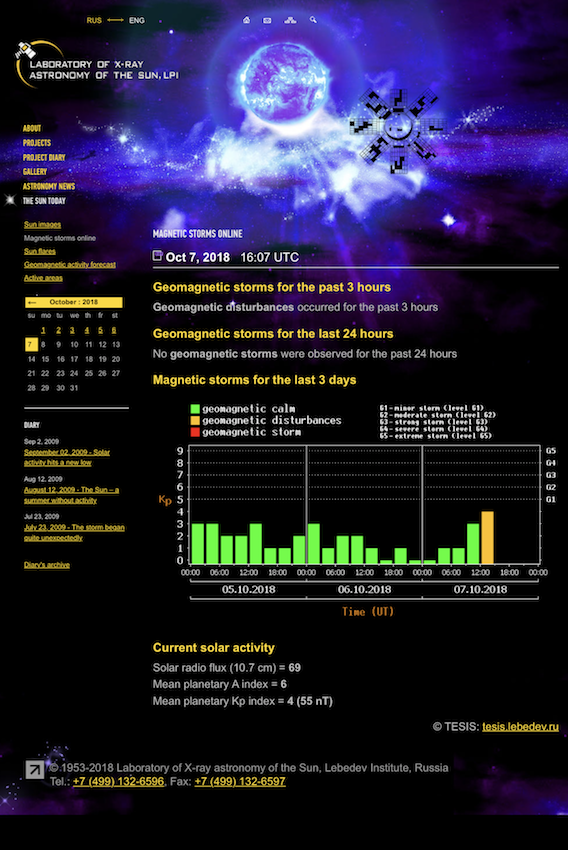
Geomagnetic storms by TESIS Laboratory of X-ray Astronomy of the Sun. Time zone is UTC +7 hours.
Remember the end of the story – the highest good of all prevails.
~ Susan V Lacerra
p.s. Although I had this article written in my mind and drafted on my blog, I’ve decided to switch the Solar Data articles to this website. I feel that these really go well with the direction I’ll be taking this blogging. Stay tuned for more updates!
*
Notes and Resource Links:
The source of all solar data charts used in this article are is the TESIS Laboratory of X-ray Astronomy of the Sun at http://sosrff.tsu.ru/
Times on all charts from TESIS are UTC +7 hours.
*
Please click and sign up to receive my Susan Lacerra Newsletter along with special messages and content!
© 2018 Susan Lacerra. All Rights Reserved. Permission is given to share this article on other blogs and websites as long as the text is posted in its entirety without alteration and with the accompanying photos, and with the author’s credit, copyright and live website links included in the article. Check out the blog and more photographs at SusanLacerra.com.
